


.png)
Using technical indicators in your trading can be powerful—but only if you avoid overfitting. Overfit strategies appear perfect on historical data but fall apart in live markets. This guide walks you through indicator selection, backtesting best practices, and genuine validation using FX Replay’s tools to stay realistic and robust.
Overfitting happens when your strategy is tailored too closely to historical quirks—leading to poor real‑time performance. It's the statistical equivalent of memorizing answers, not learning logic. That risk grows when you over-engineer indicator parameters or add too many signals just to boost past results. Avoid that by adhering to disciplined testing frameworks.
FX Replay isn’t just a replay tool—it models real orders, tracks risk and account balance, and supports deep journaling with indicator overlays. That makes it ideal for testing indicator setups realistically—not just visually FX Replay.
This video delves into using indicators, building strategy checklists, journaling, and evaluating performance inside FX Replay.
FX Replay supports dozens of indicators—from moving averages to Bollinger Bands to RSI—and lets you combine them cleanly.
Avoid subjective definitions. Turn indicator setups into testable rules. For example:
Keep your rules rigid during testing—no interpretation or “fudging” individual trades. That discipline prevents “curve fit” selection bias.
Use FX Replay to load multiple sessions—different pairs, timeframes, trending vs ranging markets. This helps test generality. For example:
Avoid testing only “ideal” periods where the strategy looks good. That leads to false security. Instead, test rough market periods too.
Inside FX Replay:
This in‑app journaling is critical to review setups later and prevent hindsight bias.
After accumulating at least 100–200 trades:
Look at performance KPIs such as:
Check consistency across timeframes, sessions, and market types. A robust strategy performs acceptably across different conditions—not just during favorable periods.
Key methods to protect your strategy:
These steps prevent building a strategy tailored only to historical quirks.
If performance is weak:
Each change should be hypothesis-driven: “If momentum shifts earlier, this filter should improve entries”—not ad hoc curve fitting.
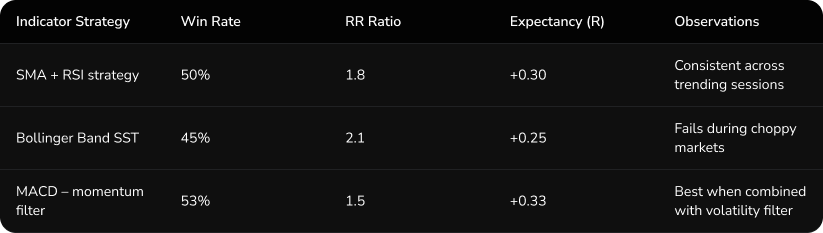
This is a hypothetical example showing how you might compare strategies.
Indicators aren’t inherently bad—but overfitting is. If your strategy logic is too broad or tailor-fit, it fails in live conditions. Instead, limit complexity, define rules tightly, journal every trade, and validate thoroughly.
FX Replay offers a backtesting environment built for disciplined strategy testing—not just visual playback. Through realistic execution, tagging, and analytics, you bridge the gap between theory and execution.
Start today:
That’s how you build strategies that work in real life, not just in hindsight.
Couldn't find your question here?
Go check out our Help Center below!
Keep it simple. Use 1–2 indicators with clearly defined, rule-based logic. Avoid tweaking parameters just to improve past results. Always validate your setup on out-of-sample and varied market conditions inside FX Replay.
At least 100–200 trades. Then assess win rate, drawdown, R:R ratio, and expectancy. FX Replay tracks these automatically—so you can focus on improving, not number crunching.
Only if they’re truly robust. Use FX Replay to run your strategy across different pairs, sessions, and conditions (trending vs choppy). If it only works in “perfect” markets, it won’t hold up live.
FX Replay goes beyond visual charts—it models real trade execution, tags trades automatically, and supports journaling. That means you’re not just seeing if an indicator “looks good”—you’re testing if it actually works in live-like conditions.
.png)
Stop wasting hours on unstructured chart review. Learn the exact workflow funded traders use to backtest faster, identify edge in any market condition, and build statistical confidence before going live.


